|
|
| |
|
 February
3, 2008 Commentary (weekend edition)- February
3, 2008 Commentary (weekend edition)-
Well, I'm
getting tired of talking about this incredible market. But now I'm hearing this
from many veteran traders, saying they've never seen anything like it. When I
see the Russell mini move up about 20 points, then sell back down 20 points,
then move up 40 points, and do it in reasonably smooth trends, and no, that's
not in a month, that's in a day, well, you know it isn't your average market.
I'm looking at this as almost once in a lifetime action, but the way it's been
lately, I wonder how long it may last. I, for one, can say I don't recall ever
seeing anything like this, but there have been some wild days when the last
bear started, I just didn't have the skills I have now, so my recollection is
not that useful for me for comparison. Regardless, this seems like more than
could ever be asked for.
One of the other things I notice about this market is
that it is not only moving incredibly, it seems to be seeing the areas I set up
better than I recall ever seeing. I wish everyone could see the posts, in
advance, in the free forum. These are not only posts I make, but by many
others. It's just amazing how many things are discussed and then the market
'sees' these areas and reacts. I'm not making any claims (I never make
claims of any kind), I'm just mentioning that using some of my tools,
and tools others bring to the table, I sure have had fun in there with the
other posters and this market. I'm not trying to sell any books, and if you
haven't bought them, you aren't ready or you don't want them, and that's great,
just enjoy the free commentary.
Now, as far as the market, it's 'officially'
a bear market now, admittedly, by most analysts. But all of them are already
trying to pick the bottom, or say the bottom is in. Myself, I don't believe in
two month bear markets. Two month corrections, yes, but not bear markets. The
thing that supports my higher probability scenario that this is a bear now is
that so many are now bullish already, and calling the end. Look back to the
last bear. There were at least five, up to seven insane rallies (depending on
how you count them) before it was over, and every one they said 'was it'. Here
we go again. If everyone stayed bearish, then I'd worry. For now the trend is
clearly up, and that's great, but if it turns down, I won't be fighting that, I
can tell you right now. I'm just setting up the potential short areas, and
watching what it does.
Time to get to work. Let's start with last month's
'Jim's Chart of the Month', updated to today. For the time being, I will
'retire' this chart for awhile after today, because I think everyone is getting
bored with it.
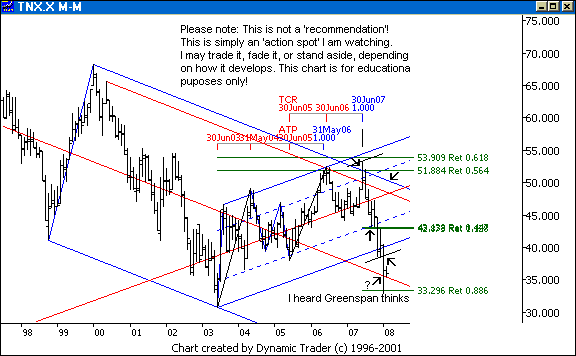
Rates kept dumping as the Fed went nuts
dropping the Fed funds target, and went right for the median line, and
continued on from there to the .886 retracement of that monster low, where it
bounced, and is now hanging around the median line. Just take a look at where
that lower parallel comes in. Are we headed for 0% like Japan? I would be
watching for a 'test' from below of that key upsloping lower parallel. We'll
move on to another chart of the month, and I'll revisit this one, perhaps in
the commentary, if anything noteworthy develops. In the meantime, watch those
rates.
Let's move on to the INDU, on a daily chart. This was where we left
off in the last commentary.
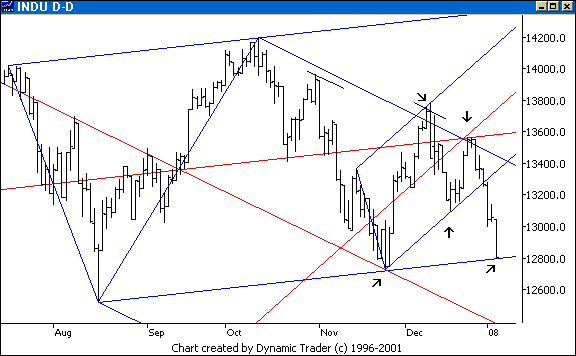
I got a lot of positive comments on the
linework in the last commentary, so I decided to continue that theme. The INDU
was moving line to line, and stopped right at yet another line. I was going to
be surprised if this area held, given what I felt was an emerging bear market,
but I was ready for a possible bounce, if it happened.
I'll add on a
few lines, and we'll discuss that.
I added on a natural set, which is a key one
I had been watching. I can only show so much on one chart or the eye
unaccustomed to so many lines will only see a jumble, and conclude it's not for
them. Notice how this set has been 'seen' pretty well by the price up until
now, and how it also shows this current area as important to watch. If it goes,
it may produce a flush. I also added a division line, in gray, for the bigger
set we had on there, and the blue upsloping line, which is a division line for
a key weekly set that goes back all the way to the bull market start.
The line
convergence is highlighted by the lower arrow, and was a key spot for me to
watch. Let me note that this was a key .382 area for the S&P and the INDU
(not shown), although the .382 was just a slight bit (for a weekly/monthly
retracement) below the line convergence on the INDU.
Let's move
on, and see what happened from here.
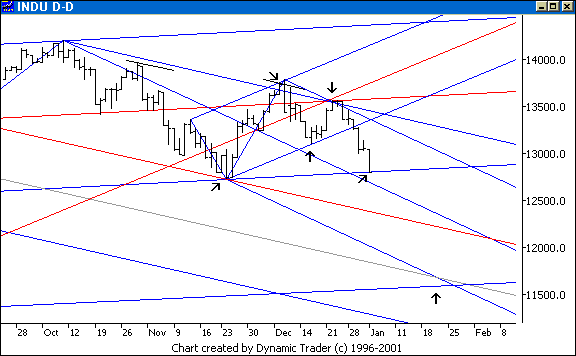
The INDU struggled with the first area, but
it seemed inevitable that it wouldn't hold, as it 'tested' it from below,
before giving way. It then shot straight for the lower area, in the 'global
panic'. Right at this low area the Fed comes in and goes wild. I mentioned in
the forum that it seemed extremely likely that they would act right in here,
and they did. Just another 'coincidence', I'm sure, acting right at a key
area.
Let's see what it did from here.
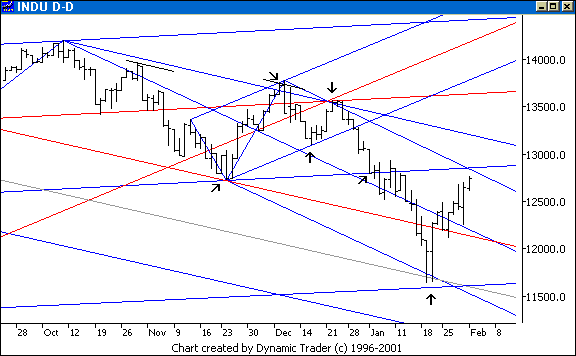
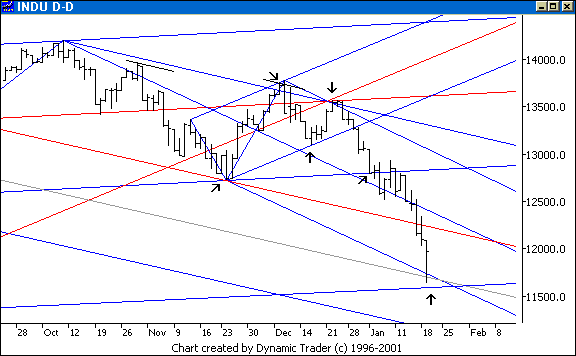
After some serious retesting of the area, it
finally started up in earnest, and it is still rising off the area. But notice
what is right overhead, and just above that. I have purposefully left the Fibs
off today, partly to focus on the lines, and partly because what has happened
since we started up is starting to get into some material I would rather not
make as public as possible in a free commentary like this. We discuss it in the
forum, but I am also starting to get qualms about what I am revealing in there,
too, so we'll just stay with lines for now. It is worthy of note that the
S&P reversed within a few points of that key .382 retracement off the
entire bull run, right at the line convergence.
Let's see what happened on the way
up, on a 60-minute chart.
The upper arrow shows a key area I was
watching (based on the downsloping set), not only on the S&P, but on the
Russell. There are key Fibs here (not shown) that I watch in such scenarios
that fell right in this area. The run up from the Fed news sent it right up
there.
I posted a comment in Scott's chat room to the effect of would you
all think I was crazy if I said my bias just shifted to the short side? (This
area was also posted for the IWM, in advance, by one of the forum members in
the free public area of the forum.) Not only did it roll, and roll hard off the
area, I had the area of the lower arrow to watch for, as far as resuming the
uptrend. The Fibs at the areas were just incredible, so I suggest the readers
do the work and see what I mean. The S&P reacted right off the lower area,
and ran right up to the set upper parallels, taking out that bigger set line.
Just amazing action, and huge point swings here.
Let's look at the Russell mini, and
what it was doing.
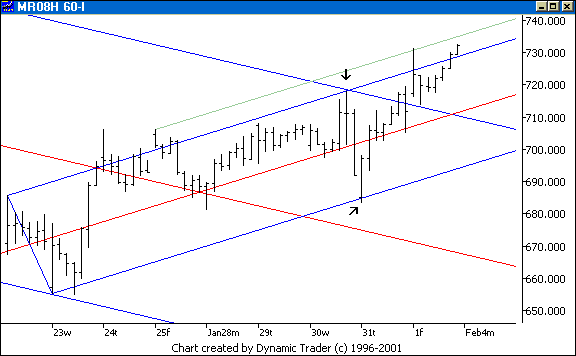
The Russell went just about dead to my line,
and rolled right off it. This was the area (Fibs not shown, but do the work...)
that had me making my fun comment in the chat. It then rolls right to that
lower parallel, and then up, through the old key line, through the upper
parallel, and on to a sliding parallel, a run of just about 50 points. And talk
about a strong close for a Friday. Now, do the work for overhead areas, and
look at the INDU chart (which is now the chart of the month), and decide what
you think are areas to watch for clues. What are the patterns, where are the
lines, what do the Fibs say, and so on.
I hope this continuation of line work has
been interesting and useful. I'm trying to show just one of multiple aspects
that come together to form my areas of interest. For me, the key is synergy. I
want a pattern, I want Fibs and harmonicity (as explained in Kane Trading on: A Totally New 5-Point
Pattern, not someone else's definition), I want lines, I want
'context', I want certain price action, I want an entry trigger, and so on. I
want them all to work together, followed by trade management, and so on, to
define a potential opportunity. Today, and last month, I showed one aspect, in
framework form, so the general idea is more clear.
As I close,
be very skeptical of claims made on the idiot box, because they all seem to
have an agenda. I'm not saying we aren't going to new highs, as we may be. The
level of manipulation seems insane to me (I am not a big believer that we have
a 'free market'), but that is just my opinion based on what I see. With all
that going on, and a constant, nonstop rah-rah team, who knows. I just know
that the bear always comes, and it seems it always fools most people, multiple
times in many cases, until they are all demoralized, and then it ends. Fool me
once, shame on you, fool me twice, shame on me. Keep that in mind as you find
your areas. Just don't get wedded to one side in the face of areas and price
action...
Finally, I am still working on the website transition, and this
should be the month where you may see problems, especially with the contact
form. If I can't get it to work I will make a note on it, in which case you can
just use e-mail to reach me. I am also having some e-mail issues, though, so if
you don't get an answer, try again, because I will answer you if I get it.
Hopefully all this will be behind us soon, and so far, I haven't had any real
issues yet (I'm just bracing myself).
The next commentary will be next month's
edition, posted by Sunday evening, March 2, 2008.
|
|
|
| |
|
|
 NOTE: Reading this page or
any page on the Kane Trading website, or utilizing this website and any
material NOTE: Reading this page or
any page on the Kane Trading website, or utilizing this website and any
material
contained herein in any way, shall constitute an
acknowledgment that you have read, understood and agreed
to all
the disclaimers,
terms & conditions, and
policies of this site.
|
|
|
This
website is best viewed with MSIE 6.0, text size set to medium, and screen
resolution set to 1024 by 768.
Copyright
© 2008 Kane Trading. All rights reserved.
|
|