|
|
| |
|
 February 6-8, 2004 Commentary
(weekend edition)- February 6-8, 2004 Commentary
(weekend edition)-
Today I will purposely stay away
from talking about the e-mini, in order to mix up the action a bit and make the
commentary more palatable for the traders that look at something larger than a
3-minute chart. I do want to point out, though, I don't really think it matters
what timeframe one is using, I feel that the concepts and ideas I present work
just about equally well regardless of the timeframe.
Given that,
if it were up to me (wait, it is up to me), I'd just show almost every
concept I want to cover with the minis, because I am the most familiar with
them. The ideas could then be adapted to whatever issue and timeframe the
readers want. But if you happen to not be a mini fanatic, I think it would be
more exciting to see some variety, so I will continue to attempt to mix it
up.
In the coming weeks I am hoping to do a lot more scanning and
looking at stocks, and presenting opportunities that I am looking at.
Understand, though, this is not a free stock picking daily commentary.
This is not the place to come to look for free hot stock plays. My focus is on
teaching the techniques that I hope will lead to independent traders. I choose
every example that I do because I think it demonstrates some point with
educational value.
Let's start with a look at FISV. When we left off, I was
waiting to see if FISV was going to become a failed pattern trade on the daily,
in favor of what I considered a more likely pattern completion on the weekly
chart. Although I didn't take a position against the daily grouping, I didn't
feel that it was necessarily a bad idea.
I more felt that I would let this
one go and wait for the failed pattern trade, if it set up. In the meantime, I
played around a little bit with FISV intraday on a 15-minute chart to see if I
could get the feel of it on that timeframe. I was hoping to get enough feel to
add that into the mix if/when it approached the grouping and perhaps 'took it
out'. I wanted to know how FISV usually acted.
Let's look at the daily chart,
showing the action since FISV encountered the grouping.
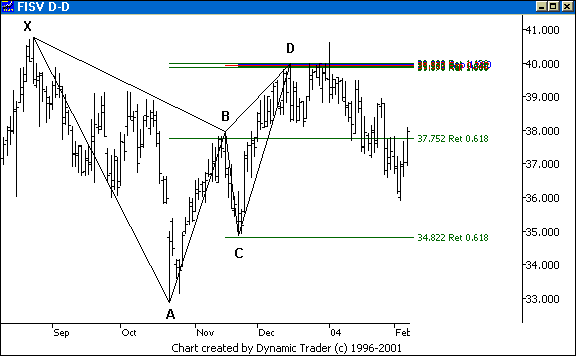
Other than that one highly illiquid, strange,
low volume spike over the grouping, FISV has turned out to be a nice trade for
those that played the grouping. That is, if they could stand some chop. FISV
has done some hard to handle overlapping swings since the drop started. It was
those swings that I was messing around with on the 15-minute chart.
Now here's my point. Let's go to
the weekly chart, and see what we see there.
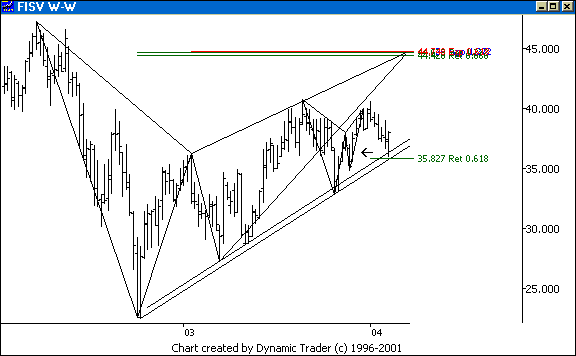
The arrow points to the smaller pattern that
we have reversed off of. The larger, weekly grouping is visible above, and the
larger pattern is highlighted. I drew in two trendlines, one a 'standard'
trendline, and one a cloned line that I laid along the two inner swing-lows.
Notice that we have pulled back right into the area between the two lines,
which also happens to overlap a .618 retracement off the A point of the smaller
pattern.
I have no idea what will happen here. I can only assess
probabilities. If FISV starts to head up strong here, I will be watching the
grouping for failure. This is a perfect area for it to launch itself from. A
nice move off of the smaller pattern to a very significant area, and then a
reversal and thrust back through the grouping.
This is what I have been waiting
for. Maybe it won't play out. I'm only pointing out that we are now 'set up to
be set up'. I'm getting ready. In the meantime, I may play around on the
15-minute chart.
Let's take a look, now, at a setup I saw come together in VTSS on
Wednesday and Thursday of this past week. It fit right in with what I showed in
the minis, as far as the lower timeframe. I'll start with a daily chart,
showing a great ABCD setup.
Recall from Kane Trading on: Trading ABCD
Patterns how I really like to trade ABCD patterns, especially with
certain parameters that I lay out in the book. I have remarked many times that
if I had any sense at all I'd just specialize in trading nothing but what I put
in that book. I really feel that way.
The most common question I get after someone
reads that book is an almost a semi-puzzled sounding 'It seems like you could
just trade these patterns exclusively??' They are asking me if I feel, in my
opinion, that the obvious could actually be the case. The feeling, they tell
me, is that it just couldn't be that simple.
Understand, every 5-point pattern
that you have every seen or traded is based on, and built around, an ABCD
pattern. A 5-point pattern is nothing more than an ABCD pattern with
certain context. It is still ABCD pattern trading. In Trading ABCD
Patterns I show ways that I feel I have greatly improved my own 5-point
pattern trading.
A lot of readers have told me it's my best book. The only thing I
wish I could change is the number of people that don't buy the book, thinking
that they already have ABCD patterns down, they are basic, or they aren't worth
trading. I think they are missing something spectacular, at least with the more
advanced work I have done with them.
Let's get back to VTSS on a daily, and what I
saw set up.
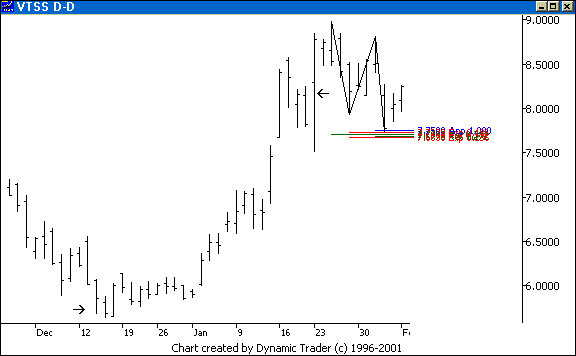
I saw a great looking ABCD pattern
come together right at a .382 of the run up. The arrow points to what I feel is
erroneous data, at least from a trading standpoint. If it weren't, it would
also make for a great 5-point pattern. I chose to ignore the data. Look at the
1-minute chart and the time & sales, and make your own call.
I was
watching down on the 5 and 15-minute charts for a trigger. I didn't like VTSS
closing at the low of a plunge bar just as it hit the grouping. Let's look at a
5-minute chart, and we'll discuss how I looked at this one.
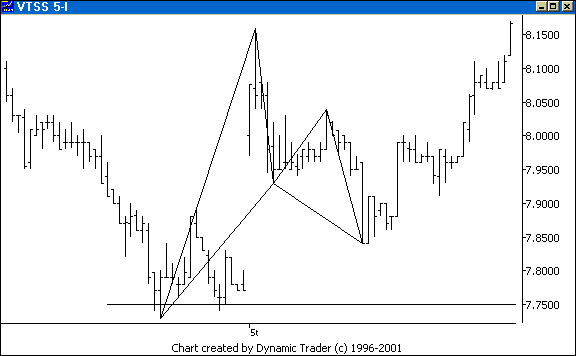
The horizontal line shows the area where the top of the
grouping was. VTSS had bounced and then dropped right back down. It just was
not giving me anything to trigger a long entry at that point. The next day it
gapped up strongly, and I chose not to play a small pullback entry. I rarely do
that (FDX is an example of when I did do it).
Instead I waited to see what
developed. Shortly into the session a nice 5-point set up and a sharp reversal
ensued. This gave me a 'grade A' entry trigger. Did it bother me that it hadn't
closed the gap? Not really, because I felt that if it came all the way back
down to close the gap, I wasn't interested. The gap closure was too far down.
My play was to bet that the gap wouldn't be closed because VTSS was too
strong.
My point on this last example is to show how I frequently use the
same exact setups on the lower timeframes to trigger me into trades on higher,
sometimes much higher, timeframes. This was a great case in point where there
was a gap, which may have implied the trade was missed, only to get a superb
second chance based on a pattern setup. A lot of pattern traders do not look
for this, and perhaps they should.
|
|
|
| |
|
|
 NOTE: Reading this page or any page on the Kane
Trading website, or utilizing this website and any material NOTE: Reading this page or any page on the Kane
Trading website, or utilizing this website and any material
contained herein in any way, shall constitute an acknowledgement
that you have read, understood and agreed
to all the
disclaimers,
terms & conditions, and
policies of this site.
|
|
|
This website is best viewed with
MSIE 6.0, text size set to medium, and screen resolution set to 1024 by 768.
Copyright © 2003 Kane
Trading. All rights reserved.
|
|

